Do you want to create maps for your research or other eye-catching data visualizations but don’t have the GIS knowledge or skills? The University Libraries has acquired a one-year full access trial for Social Explorer, a web-based online demographic research tool that helps researchers and students visualize, explore, and compare complex demographic information. Social Explorer provides access to over 220 years of comprehensive demographic information, including the entire US Census from 1790 to the most current year available. In addition to demographic data from the census, Social Explore provides economy, health, education, religion, crime, and more from trusted public and proprietary sources.
This tool allows users to visualize and explore change over time, understand patterns behind the raw numbers, and create user-friendly interactive and navigable thematic type maps for research, papers, and presentations.
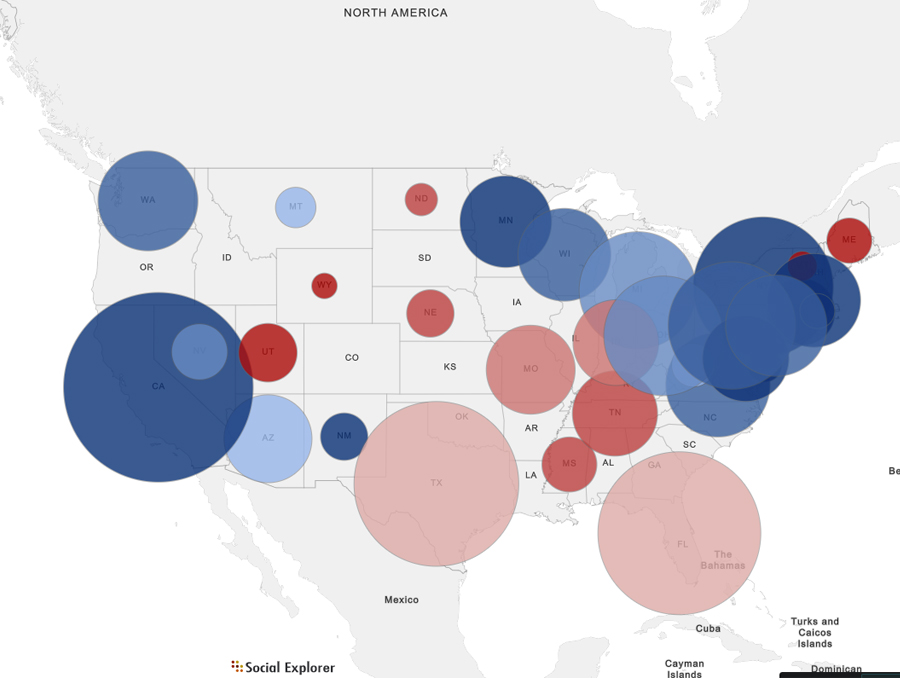
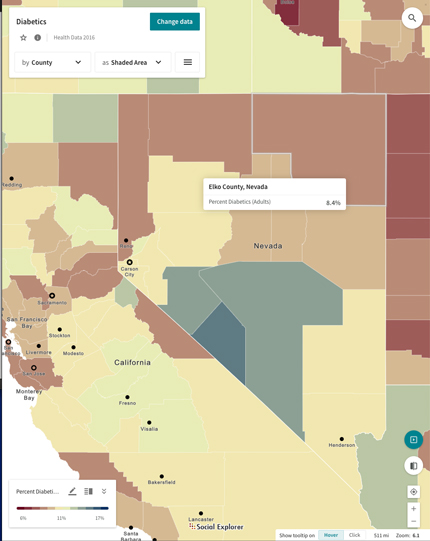
Social Explorer provides three different thematic visualization types:
- Shaded Area (Choropleth maps)
- Bubbles (proportional symbols)
- Dot Density
There are also three different map layouts you can choose from that include:
- Single: shows a simple map window with one variable.
- Side by side: shows two completely independent maps windows side by side. There is no collection between these maps. You can change the variables, the zoom, the targeted area, and the visualization type of map you desire.
- Swipe: The swipe option allows you to look at two different variables in the same geographic contexts.
With Social Explorer, you can:
- Create and customize thematic and interactive maps
- Navigate current and historical demographic data and surveys
- Create data reports based on historical and modern US census data at all geographic levels
- Download custom datasets and more
Social Explorer is on trial at the University Libraries’ until December 31, 2020. Check out this new resource and let us know what you think!
About University Libraries
The University Libraries embrace intellectual inquiry and innovation, nurture the production of new knowledge, and foster excellence in learning, teaching and research. During each academic year, the Libraries welcomes more than 1.2 million visitors across its network of three branch libraries: the Mathewson-IGT Knowledge Center, the DeLaMare Science and Engineering Library and the Savitt Medical Library. Visitors checked-out more than 90,000 items and completed more than 2 million database searches.


