University of Nevada, Reno Political Science Assistant Professor Steven Wilson downloads six million tweets a day from across the globe to identify how people communicate with one another. He has been downloading geocoded tweets since 2012 from everywhere except North America and western Europe. He uses custom software to figure out the exact location of tweets, which are accurate within two meters. He uses this data to look at political and social trends, help identify violence and how political regimes may benefit from listening to citizens.
Wilson's data analysis can be used for real-time situations. He can look at where violence occurs in real-time compared with tweets posted in the same geographic location at the same time. He can evaluate historical data as well. He looked at previously downloaded tweets from the Nigeria Ebola outbreak in 2014. The tweets are so accurate, he knows the exact hospital the first case was reported and can read what was going on that afternoon and what people were saying at the time the case was reported.
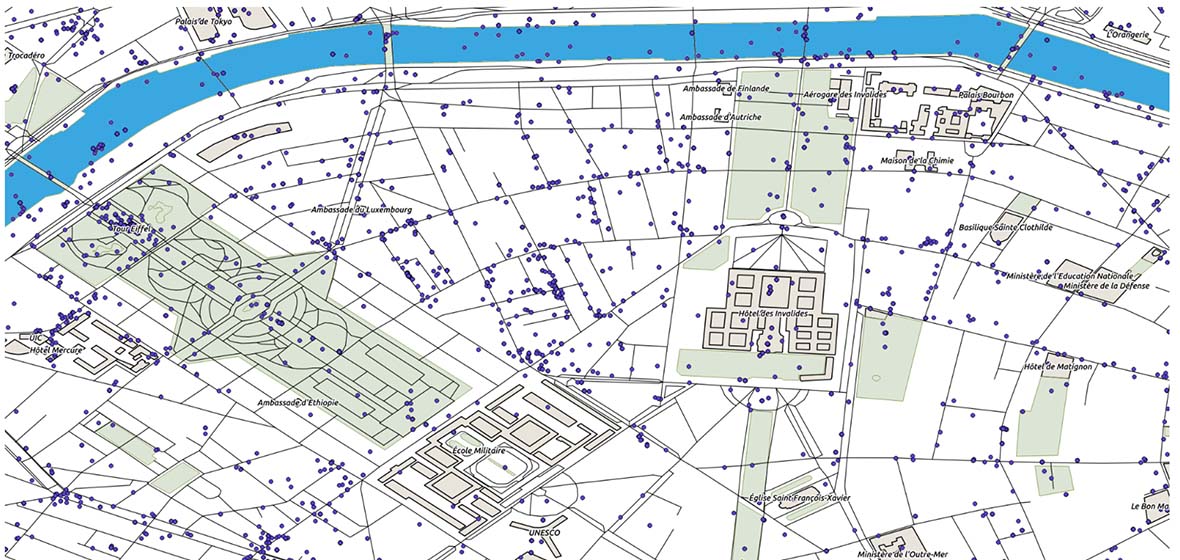
The center of Kiev, Ukraine animated for the three days at the climax of the Euromaidan protests (timestamp is at the bottom right corner). Purple dots are individual tweets, red dots are where instances of violence occur. It animates in 15-minute time increments and dots disappear after an hour so that they don't accumulate and overwhelm the map.
The Kavanaugh keyword
More recently, Wilson ventured into studying American social media data when he teamed up with his colleague Assistant Professor Jeremy Gelman who studies American politics. They put together common key words and search terms for the upcoming election including, "Kavanaugh," "Nafta" and "Election." When they were in the process of analyzing this data at the end of September, the number of tweets that mentioned "Kavanaugh" at its peak was one in 20 tweets - which reached beyond the popularity of Super Bowl-level keyword mentions.
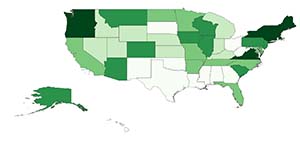
Map of the United States showing what proportion of tweets from each state on September 27th (the day of the hearing) mentioned Kavanaugh by name, with the darker states having more mentions.
The research duo quickly realized this was more than just political speech. They started looking at mentions of senators and looked at particular states of origin to help identify if the increase in the Kavanaugh search term was from people generally "yelling" at people in congress or more specifically from a congressional district. Wilson found it interesting that certain states in the U.S. spiked much higher in using the Kavanaugh keyword. Maine identified with the highest usage per capita.
The other thing Wilson found really interesting with the Kavanaugh tweets was that he originally assumed tweets would occur as either pro or against Kavanaugh, but what he found was that dimension didn't emerge. Instead, a hashtag rage discourse emerged, such as #StopKavanaugh or #ConfirmKavanaugh. Then Wilson looked at how profane people were tweeting during this time. Usually, 4.5 percent of tweets are profane, but during the Kavanaugh peak, profane tweets grew to 7 percent. Gendered insults also elevated and showed Wilson and Gelman just how civil or not the discourse really was.
"The most exciting thing is seeing the way people really do talk and communicate with each other given the chance to," Wilson said.
Twitter and politics
Private companies have enlisted the help of Wilson on evaluating the dangers to elections worldwide and whether or not social media platforms can elevate that risk. Wilson also mentioned of working on another project that will use Twitter data locally in Nevada and mapping it with early voting data to find patterns in behavior. However, Wilson said the strengths of social media data is better used to show what people are talking about and the issues that matter to people, rather than using data for political predictions.
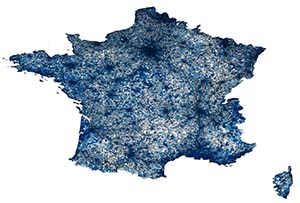
Map of France shows the density of twitter activity at the commune level (that's about two levels below counties and there are about 30,000 of them in France) during the 2017 elections.
Currently, Wilson is working on a project to identify how popular Vladmir Putin is in Russia at a regional level. Traditional survey data shows his popularity, but only at a city-level. It is difficult to measure when looking at rural-surrounding areas. This is where social media data comes in handy and can be used to estimate what traditional survey data might look like if done on the ground.
Barriers to social media data analysis
In every country, social media monitoring occurs to some degree. Wilson has to take all of his analytics with a grain of salt, depending on the regime of the particular region he is analyzing. Wilson said the countries that are better at social media monitoring causes a chilling effect where people will not be honest in their tweets or even want to use social media at all. Some countries even have different social media platforms for example, Russians don't use Facebook. Twitter however, is fundamentally external and is not directly subject to censorship. The downside though, is if users are not using a particular social media platform, then they can't collect the data.
Wilson looks at how much censorship occurs in a given country. South Korea is typically deemed as a country that scores very low on internet freedom and contains a high amount of censorship. South Korea usually falls in line with Russia. Typically, South Koreans use a platform called Naver Blogs. Wilson said if censorship were to occur, it would occur on this internal platform. He has done a comparative case with Naver and Twitter to see what the regime is censoring. What he has found though, is there appears to be no evidence of censorship occurring. He looked at statistical analysis of actual Korean language text on both Naver and Twitter, assuming limited censorship on Naver, but found that there was no result of censorship on either platform.
This research finding may be due to the fact that dictators are finding ways to use digital communication technology to makes themselves more stable.
"With the rise of social media, what smart dictators have started doing is allowing those (internet and social media) things in, but they heavily monitor them," Wilson said. "They're reading it to find out who is angry about what. They're using it to make people happy, so they don't take to the streets and protest."
Wilson gave the example of a mayor in Russia using social media to create positive change. He said at one point, the mayor refused to fix potholes in the streets, so a group of people started spray-painting the streets with an image of the mayor's face and his mouth was depicted as the pothole. They posted these images to social media. The mayor wanted to curb the protests, so he fixed the potholes. But the outcome was the citizens were better able to communicate with a dictator on what they wanted and positive change happened.
Social media and cybersecurity
Wilson's geocoded data is useful at global levels. Analyzing tweets in real-time can help change security. No longer is cybersecurity just about keeping hackers away from accessing systems. Social media posts encourage grassroots movements, which at times can lead to protests and violence. Wilson said there is a dimension of society and politics behind social media. He said it's important to, "understand people's motivations on why and how they use social media." It's this aspect that also makes social media a security concern across the world.
Wilson continues to download millions of tweets daily to be used for real-time tracking or historical reference. In addition, one of his students is writing a senior thesis on social media and politics and will be looking to survey University students on social media usage. Please email Wilson at stevenwilson@unr.edu if interested in participating.


