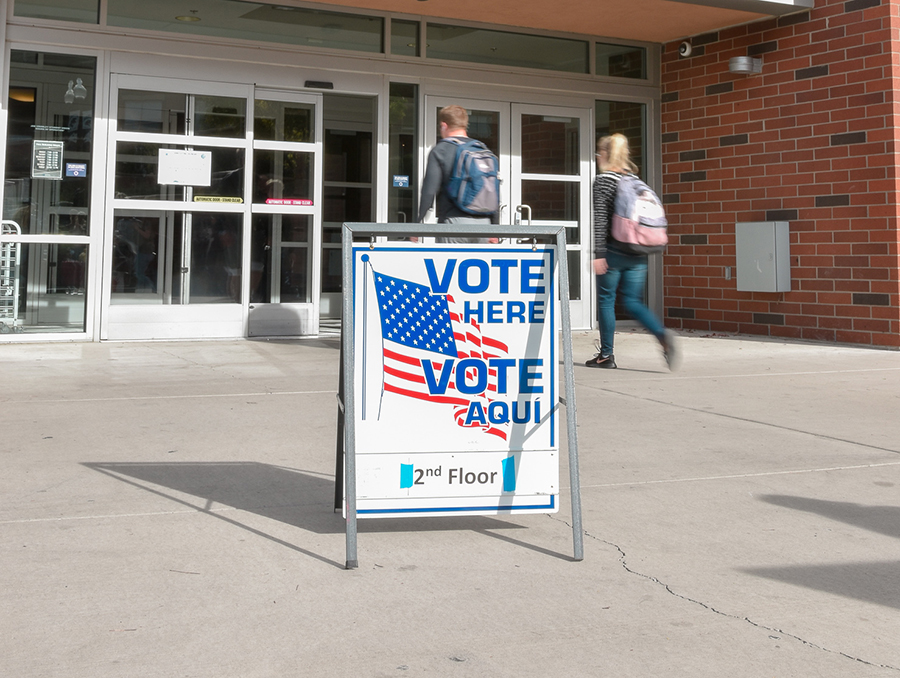
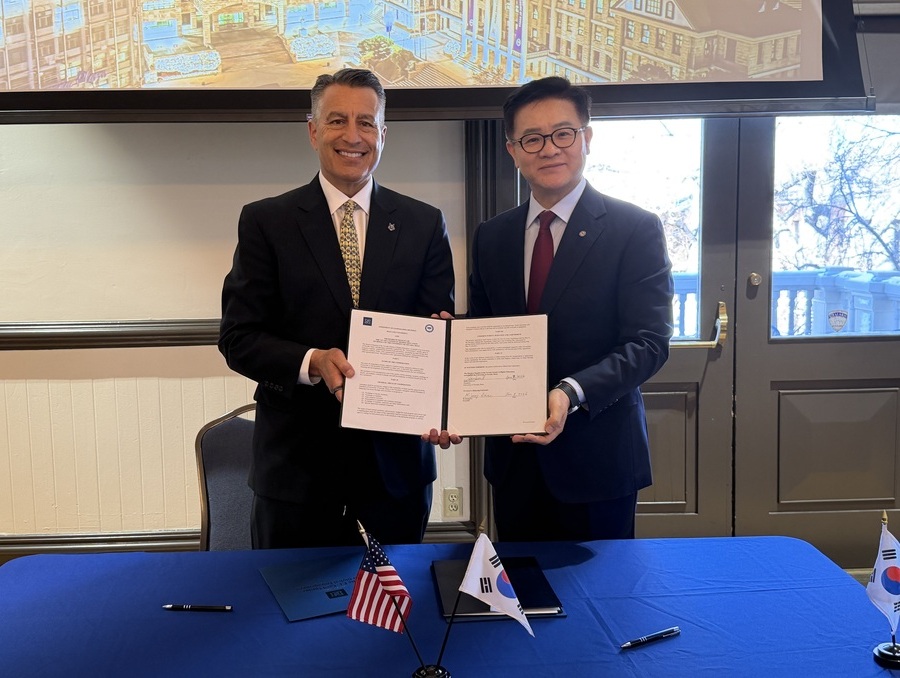
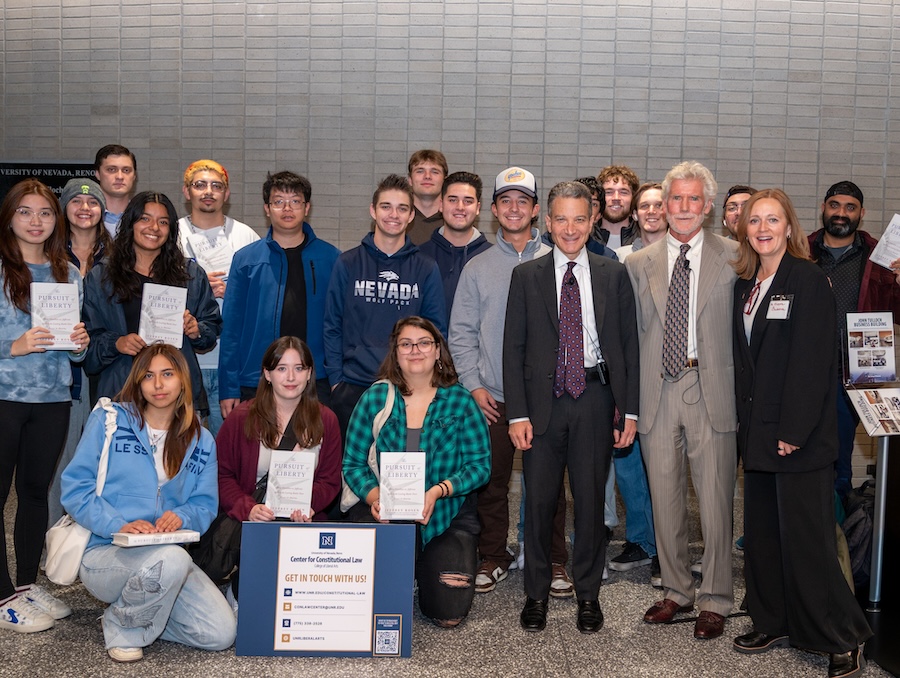
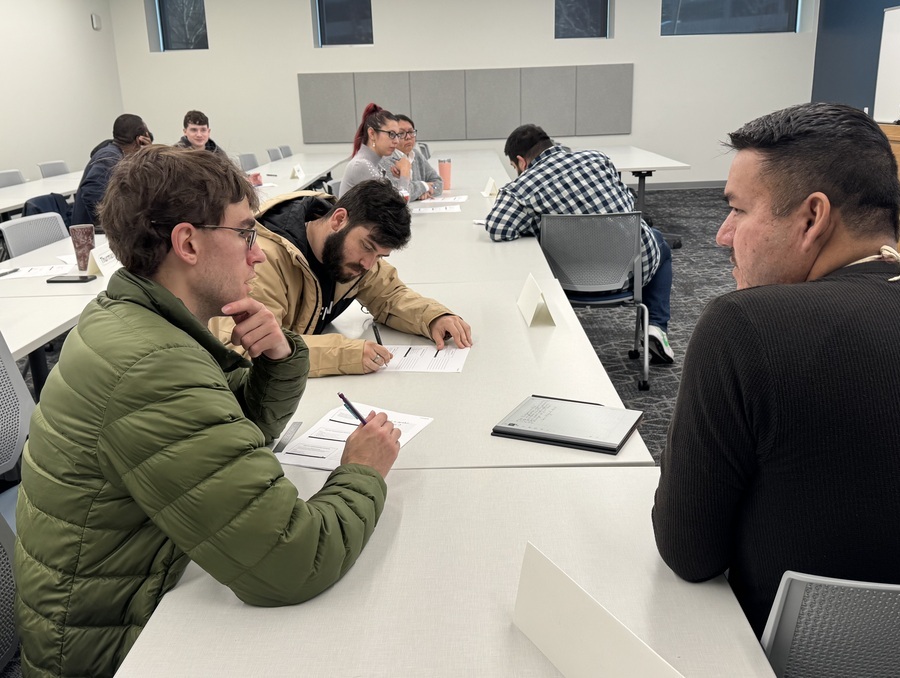
Voter turnout among college students nearly doubled in the last midterm election, according to a Tufts study of more than 1,000 colleges and universities, including the University of Nevada, Reno. In a report specific to the University, the study showed the University’s numbers dramatically increased in the 2018 midterm election compared to the 2014 election, with a 45.4 percent voting rate of students, up 27.8 percent from the 2014 election. The 2018 voting rate for all institutions was 39.1 percent, meaning the University had 6.3 percent more students voting than the national average.
The report is from the National Study of Learning, Voting and Engagement, a program of Tufts University’s Institute for Democracy and Higher Education.
“The voting data is pretty close to amazing,” Sandra Rodriguez, director of ASUN and the University’s Center for Student Engagement, said. “Our early voting initiatives and targeted initiatives worked. We had increases in voter turnout in many categories that had fallen alarmingly low in 2014. This report will help ASUN and the Center for Student Engagement, and our campus partners, to continue to bridge the gap in voter registration and turnout. It will also help us reframe the various partnerships across campus and in the community in positive ways.”
The voting rates in the report reflect the percentage of the University’s students who were eligible to vote and who voted in the 2014 and 2018 elections. These results are based on enrollment records submitted by the University to the National Student Clearinghouse and publicly available voting files. FERPA-blocked records are excluded from the data.
The breakdown…
By Carnegie classification
When comparing to other institutions, the University’s 45.4 percent student voter turnout bested the averages compiled for research institutions (41.2 percent), public research institutions (40.8 percent) and private research institutions (42.5 percent).
By voting method
Students at the University not only turned out to vote but did so in a number of ways. The study showed 52.9 percent of students voted early in 2018, compared to 32.7 percent in 2014. Rodriguez attributes part of this increase in early voting to the University working with the Washoe County Registrar of Voters Department to make the Joe Crowley Student Union an early voting location. The early voting poll location on campus was used by a record-breaking 4,318 individuals during the mid-term elections in 2018.
More students also voted by mail in 2018, with a rate of 15.2 percent, as compared to 12 percent in 2014. One of the ways the Center for Student Engagement assisted in this effort was by working with the registrar’s office to enable residence hall students, who don’t have a physical address, to claim the University’s Center for Student Engagement as their mailing address. They then held ballots in a safe until students claimed them in-person and by showing a valid ID.
By age group
Voting data showed a significant spike in younger University students who voted. In 2018, 40.9 percent of students at the University ages 18-21 voted, compared to 12.7 percent of students who voted in that same age group in 2014. Students between the ages of 22-24, voted at a rate of 44.2 percent in 2018, compared to 16.5 percent in 2014, and 48.5 percent of students between the ages of 25-29 voted in 2018, compared to 21.5 percent in 2014. While all age groups saw increases, the survey shows the most significant increases in the younger demographics.
By education level, class year and enrollment status
While this data is unavailable for 2014, undergraduate student turnout in 2018 made up 42.9 percent of undergraduate University students who voted and 50.7 percent of University graduate students who voted. First-year students increased 26 percentage points – from 10.6 percent of first-year students in 2014 to 34.6 percent of first-year students at the University in 2018. Sophomore student voters increased 27.6 percentage points – from 13.2 percent in 2014 to 40.8 percent in 2018. Upper-level student voters increased 28 percentage points – from 18.8 percent in 2014 to 46.8 percent in 2018.
In 2018, 42.4 percent of full-time students voted, compared to 14.6 percent in 2014. Part-time student voters increased in 2018 to 51.1 percent, compared to 24.9 percent in 2014.
By gender*
More female University students (47.6 percent) turned out to vote in 2018 than male students (40 percent). This was also true in 2014, but with a smaller value of 17.5 percent of female student voters and 16.5 percent of male student voters.
*Male and female gender classifications are based on the data collected.
By race and ethnicity
The numbers show a dramatically positive increase in each reported race/ethnicity. Note, the races and ethnicities listed below are based on how students self-identify on the enrollment application to the University.
| Year | Asian | American Indian/ Alaska Native |
Black | Hispanic | Native Hawaiian/ Pacific Islander |
White | 2 or more races |
| 2018 | 37.4% | 45.5% | 37.8% | 44.3% | 26.2% | 47.1% | 42.4% |
| 2014 | 9.2% | 17.5% | 12.3% | 13.7% | 5.5% | 19.4% | n/a |
In addition to the comparisons offered above, NSLVE also broke down students’ data by field of study. Given that the study findings themselves are not accessible, the University has decided not to post them online in their totality. That said, anyone who is interested in learning more about the report can contact Sandra Rodriguez at srodz@unr.edu.
A sign of things to come?
Many reporting on this survey, including the “Washington Post” and “Inside Higher Education,” sight the study as a glimpse of things to come stating college students may likely influence the coming presidential election.
“There are a lot of hot-button issues on the table right now that college students are incredibly involved in and care about,” Rodriguez said. “From student loans to climate change to foreign and domestic policies, our students are certainly not immune to legislation being passed by local, state and national leaders. We’ve seen a variety of impacts on this campus in recent years and will undoubtedly see more before this next election. It’s my ongoing hope and drive to see students embrace their civic duties, first and foremost through the voting.”
Voter Friendly Campus
In April 2019, the University once again earned the designation of a “Voter Friendly Campus” though a program sponsored by the National Association of Student Personnel Administrators (NASPA), a leading voice for the student affairs profession and the Fair Elections Center’s Campus Vote Project.
The Voter Friendly Campus designation program strives to help students overcome barriers preventing participation in the political process and develop a culture of democratic engagement on campus. The University is one of 123 colleges and universities in the country to receive the designation, with a total enrollment of nearly 2 million students in the Voter Friendly Campus campaign.
University campus representatives participate in ongoing trainings to develop, implement and report results for engagement programs that encouraged students to register and vote.
- ASUN Officers and Center for Student Engagement professional and student staff table during orientations and campus events to register students to vote.
- Student government officers coordinated town hall meetings, dialogues and candidate forums to discuss a variety of issues.
- Partnerships across campus allow for information about absentee ballots, early voting poll locations and deadlines to be distributed to various pockets of students including Res Halls, Club and Organization and various academic classrooms.
- Additionally, voter registration and voting are promoted by way of campus-wide text messages, neighborhood canvassing, a student-produced video and weekly newsletters.
The University will continue to encourage students' civic development through thoughtful community partnerships, engaging leadership opportunities and democratic participation.
“Motivating students to register and vote establishes civic habits that last well beyond the collegiate experience,” Rodriguez said. “Incorporating democratic engagement into campus life creates stability for students as they explore their political beliefs. The goal is to drive civic learning and democratic engagement work within the teachings of the academic classroom and with interactions in the community.”
