Strengthen the Pack
Enable inclusive excellence for our students, faculty, and staff
Strategy 1
Increase equitable student outcomes while growing enrollment to 25,000 by FY2030
Enrollment
A. Provide access for all of Nevada’s students and be a compelling choice for Nevada’s most academically prepared students
B. Deploy a data-driven framework that identifies and resolves inhibitors to equitable success and addresses the opportunity gaps throughout the lifecycle (e.g., admissions, retention, etc.) from prospective students to alumni
C. Assess undergraduate student demand trends to identify opportunities to invest in target markets, both in-state and beyond, and achieve related growth-oriented success metrics
D. Identify opportunities to grow graduate enrollment by determining areas of opportunity and removing inhibitors (e.g., stipends, enrollment caps, recruiting resources, etc.)
E. Execute the University’s DEI Strategic Action Plan to increase diversity, equity, inclusion and access in recruitment, matriculation and persistence to seek recognition by the US Department of Education as a Hispanic Serving Institution (HSI) and an Asian American, Native American and Pacific Islander Serving Institution (AANAPISI)
F. Establish an office to grow partnerships with other institutions and improve the transfer process, focusing on Nevada two-year institutions and international students
G. Pursue partnerships with Historically Black Colleges and Universities (HBCUs) and other Minority Serving Institutions (MSIs) to build pipelines for graduate degree programs
Experience
H. Strengthen support programming for diverse groups as recommended by the MSI taskforce and provide educational resources for students on the comprehensive benefits of enabling a diverse, equitable and inclusive environment
I. Collaborate with local and state Tribes’ leadership to promote their heritages and strengthen ties with the University community
J. Attract and maintain a highly qualified and diverse group of undergraduate academic advisors to serve students and career advisors/services to empower students for success after graduation
K. Assess effectiveness of undergraduate advising and student success support to enhance resources and programming for students
L. Increase accessibility to childcare, housing, transit, mental health and wellness resources, affordable healthcare and food insecurity services for all students
M. Collaborate with student leadership to formalize communication channels for student feedback on the student experience to leadership
N. Implement the internationalization committee’s recommendations to increase international exchange and experience opportunities, including study abroad
O. Expand undergraduate research opportunities equitably for all students in all fields of study
Benchmark data from 2021 for reference
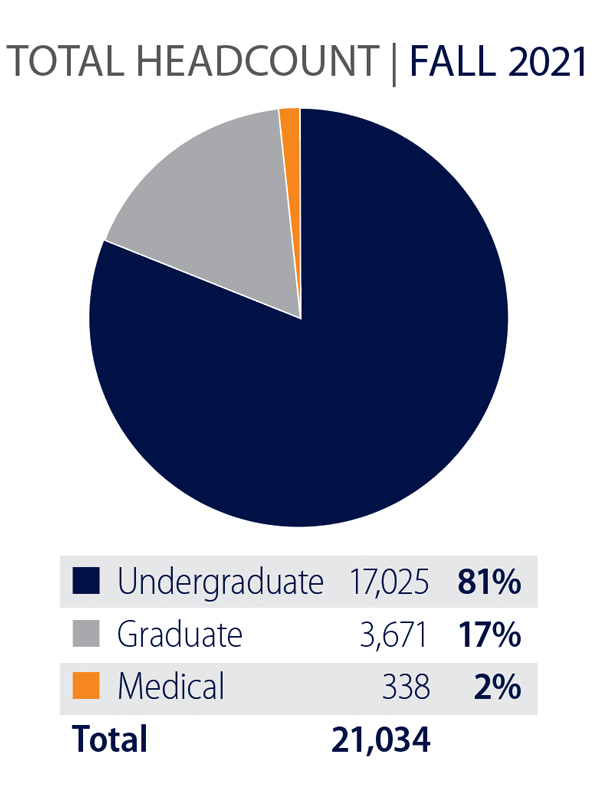
Fall 2021
Student-to-faculty ratio
19:1
Fall 2021
Student-to-advisor ratio
350:1
Strategy 2
Become a career destination for diverse faculty and staff
A. Increase the number of faculty and staff as required to support projected enrollment growth and educational demand
B. Develop a performance pay model and reward structure to recognize achieved goals and objectives
C. Identify gaps in salary parity and establish a roadmap to achieve compensation equity
D. Adjust, where possible, performance evaluation criteria to include strategic priorities, including, but not limited to, recognition of teaching; research; service; DEI engagement; creative activity; and recruiting, hiring and mentoring metrics
E. Increase faculty and staff diversity to achieve alignment with the National Association of System Heads (NASH) Equity Action Framework on hiring, retention, promotions and rewards best practices
F. Embed teaching and classroom management skills into the faculty development program that promote mindfulness of the University’s values, DEI and the freedom of critical thought and expression
G. Enhance internal communication efforts between faculty, staff and administration, as well as across campus units, using a variety of channels and technology
H. Invest in formalized professional development for faculty and staff, with attention to discipline-specific instructional programming
I. Increase access to resources for faculty and staff for coordinated mental health and wellness, childcare, housing, transit and food insecurity services
J. Develop and execute a strategy for assessing faculty and staff engagement and morale to identify strengths and opportunities for improvement
Benchmark data from 2021 for reference
Directional outcomes and metrics
Students
❑ Enroll 23,000 total student headcount by Fall 2025
❑ Increase enrollment of first-year, in-state students, including total first-year enrollment to 4,000 by Fall 2027
❑ Increase transfer students to 1,500 total enrollment by Fall 2027
❑ Increase freshman retention to 87% by Fall 2027
❑ Increase retention rates for all students in total and for all minority student cohorts
❑ Increase six-year graduation rate to 65% for Fall 2021 cohort
❑ Achieve U.S. Department of Education designations of Hispanic-Serving Institution and Asian American, Native American and Pacific Islander-Serving Institution by Fall 2027
❑ Maintain at a minimum or outperform the NSHE required student-to-advisor ratio of 350:1
Faculty and staff
❑ Launch a performance pay model by FY2023
❑ Increase retention rates for all faculty and staff
❑ Increase annual engagement and sentiment scores for faculty and staff
❑ Maintain or decrease existing student-faculty ratio of 19:1 concurrent with expected enrollment growth